
At a glance
Swipe to compare all columns.
| Check | Calculate from | Decision |
|---|---|---|
| Stop coverage | Net bottle inflow × interruption time | Enough free positions? |
| Usable length | Total positions × accumulated bottle pitch | Will the queue fit and handle correctly? |
| Recovery | Extra bottles ÷ net withdrawal rate | Will working occupancy return before the next stop? |
Size free bottle positions before choosing conveyor length
An automated filling system needs enough free bottle positions between its filler and capper to absorb the net inflow during a chosen interruption. It also needs a recovery period in which the capper withdraws bottles faster than the filler releases them. Size those two conditions together: storage covers the interruption, while the rate difference after restart restores the space for another stop.
Here, a surge buffer means filled containers held on a conveyor or accumulator. Start with an independently conveyable bottle stream between separate stations. For a mechanically coupled filler and capper, or a process with a controlled transfer environment, use the permitted machine interface and stop sequence to establish whether independent holding is possible. The automatic filling line layout should identify that interface before equipment length is selected.
The calculation follows a practical sequence: define the counting points, find the maximum added inventory, include the bottles already present, translate positions into usable geometry, then check recovery. A permanently slower capper will eventually fill any finite buffer unless upstream release is reduced. That rate mismatch needs a production or equipment change.
Use matching rate units and physical count boundaries
Packaging line output is measured in containers or accepted packs per defined time interval, such as bottles per minute or good packs per shift. State the counting location and whether the interval includes stops. Belt velocity, measured in metres per minute, describes travel; machine cycles describe repeated motion. Neither establishes the number of acceptable packs delivered by the whole line.
For this buffer calculation, count physical bottles entering and leaving the selected conveyor boundary. A bottle that will later fail inspection still occupies a position now. If a reject device removes bottles inside the boundary, record that additional outflow. Keep the final accepted-output count separate from this inventory balance, and use the filling accuracy and production speed guide when defining finished-pack acceptance.
Record the actual release and withdrawal profiles for the bottle format under review. A machine speed setting can differ from the flow at the interface during gaps, batch releases and restart ramps. Use synchronized timestamps at both count points so a delayed arrival is assigned to the correct part of the event.
| Symbol | Meaning | Unit / measurement |
|---|---|---|
| qF, qC | Buffer inlet and capper-bound outlet rates | Bottles/min at the two count points |
| ts | Selected interruption duration | Seconds |
| N0 | Occupancy at event start | Bottles inside the boundary |
| C, M | Usable capacity and retained free-position reserve | Bottle positions |
| Lu, pa | Usable length and accumulated centre-to-centre pitch | Metres; metres per position |
| Nlow | Minimum accessible inventory for stable downstream feed | Bottles |
Calculate additional positions for a capper stop
For a constant-rate interruption, multiply the positive inlet–outlet rate difference by its duration. Convert seconds to minutes and round the required positions upward. If the capper stops completely, its withdrawal rate is zero. The resulting added inventory is the extra space required for that event; the bottles already travelling through the conveyor still need their own positions.
The underlying stock-flow relation is initial inventory plus accumulated inflow minus outflow, as set out by Cronin, Gonzalez and Sterman in Why Don’t Well-Educated Adults Understand Accumulation? Applying that relation to a bottle-transfer boundary gives the capacity checks below.
Choose N0 from the occupancy at which the interruption can actually begin. Testing with an empty conveyor can overstate coverage during normal production. M is a deliberately retained allowance supported by the stop response and release records. Both N0 and M are whole-bottle counts. A capacity result is usable only when those bottles can physically reach and occupy the available positions.
| Situation | Formula | How to read it |
|---|---|---|
| Constant-rate slowdown | Nadd = ceil(max(0, qF − qC) × ts / 60) | Additional positions; ceil means round upward |
| Capper fully stopped | Nadd = ceil(qF × ts / 60) | Withdrawal is zero during this interval |
| Existing conveyor check | C − N0 − M ≥ Nadd | Remaining usable space covers the event |
| Required total capacity | Creq = N0 + Nadd + M | Include normal occupancy and retained reserve |
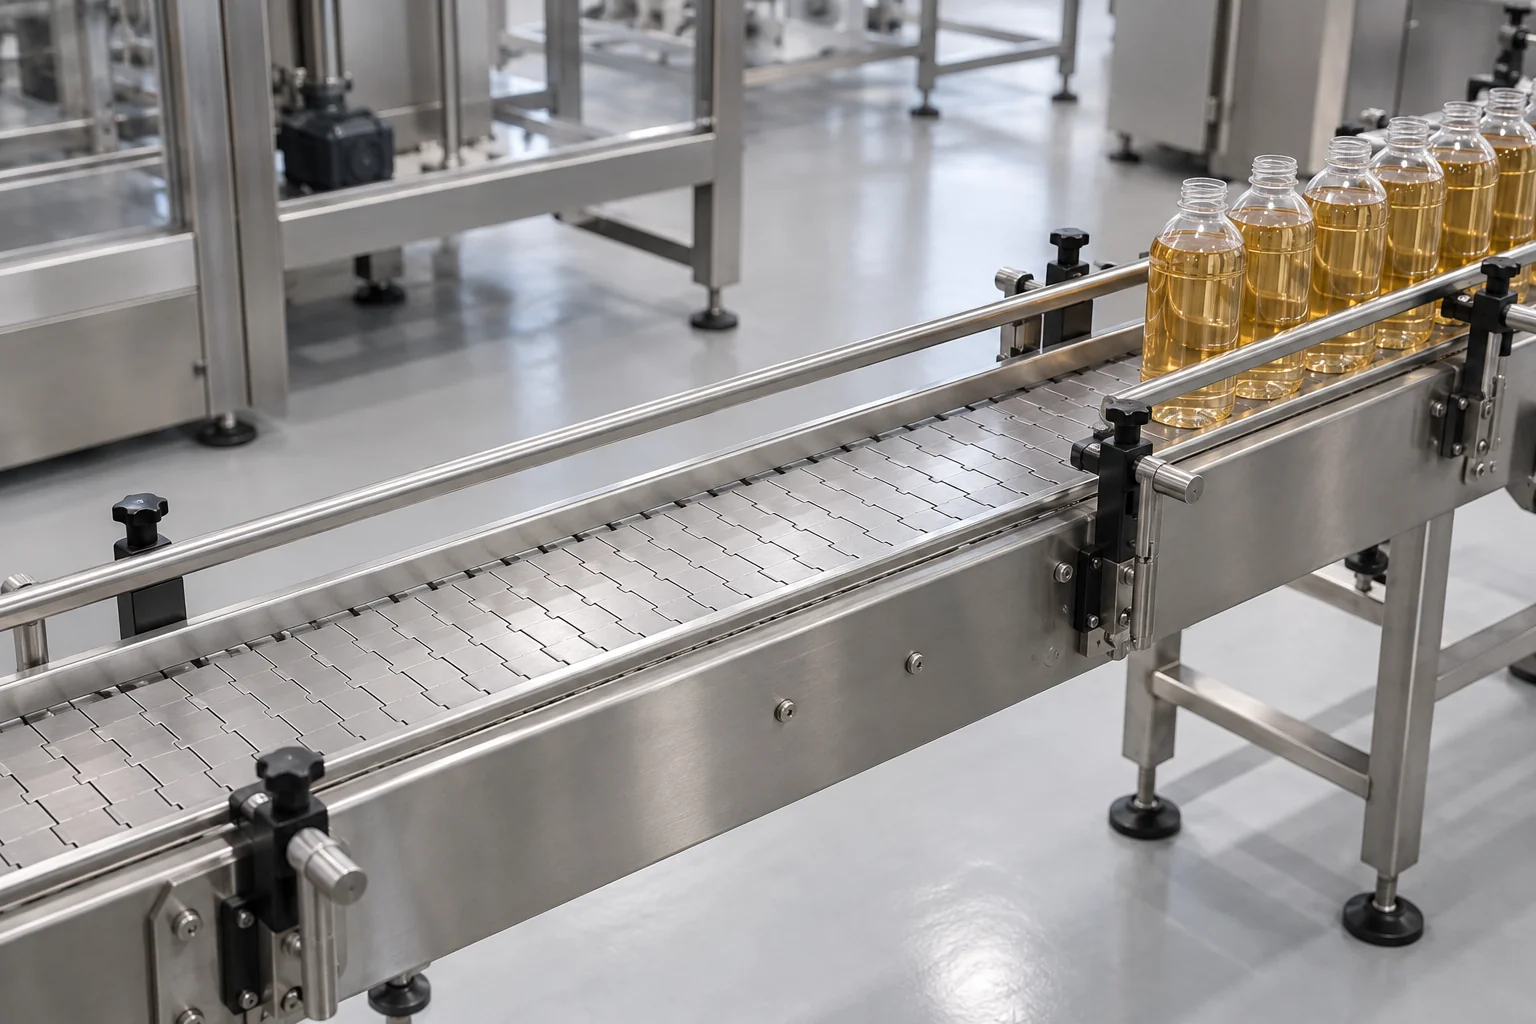
Include restart ramps and bottles released after a stop signal
For changing rates, track the running inventory through the whole event and restart. Over each recorded interval, add bottles entering and subtract bottles leaving. The largest cumulative increase sets the extra storage requirement. A final balance of zero can conceal an earlier peak that would have filled the conveyor.
With rates in bottles per minute and time t in seconds, the continuous relation is N(t) = N0 + (1/60) × ∫ from 0 to t [qF(u) − qC(u)] du. In a spreadsheet using interval-average rates, calculate each increment as (qF − qC) × interval seconds / 60, then carry the inventory forward. Use sufficiently detailed counts or intervals to capture batch releases and brief peaks; round the resulting capacity requirement upward.
A filler may continue releasing committed bottles after the downstream stop request. Include the observed response tail in the time trace. If it is accounted for separately, its constant-rate contribution is ceil(qF × response seconds / 60), plus any independently counted residual release. Put those bottles in the event calculation or the reserve once, so the same release is not counted twice.
Potential rates that predict inventory below zero indicate starvation; a prediction above usable capacity indicates a required stop or slowdown. Actual flow changes when either limit is reached. Keep these events visible in the analysis. Select the interruption duration and recurrence from the faults or replenishment events you intend to cover, and retain the associated starting occupancy.
- Record one row per event interval: timestamp, inlet count, outlet count, any reject count, occupancy and station state.
- Mark the maximum occupancy and the time working occupancy returns.
- Continue the record through the next interruption when the first backlog has not yet cleared.
Convert bottle positions into usable accumulation length
Use the longitudinal centre-to-centre pitch in the permitted accumulated condition to estimate storage length. For round bottles, that pitch is the diameter plus the allowed gap. For oval or rectangular packs, measure the container envelope in its actual travel orientation. Distinguish this accumulated pitch from the larger spacing that may exist during normal movement.
For a straight single-file section, a first layout check is Cgeom ≈ floor(Lu / pa), where floor rounds down. Conversely, Lreq ≈ Creq × pa estimates the required usable length. Define the end convention on the layout and then count the actual positions available through the section. Transfers, curves, sensing zones, stops and capper infeed requirements can remove positions from the usable total.
Nercon’s The Accumulation Conversation links accumulation length to friction and product back pressure. Evaluate the filled bottle at the intended queue length: check tipping, spills, surface damage, guide contact and release stability. A longer queue can fail the handling check before every geometric position is occupied.
Add capacities across lanes only when those positions are independently usable and can discharge as required. A recirculating table or converging flow needs its actual paths and release behaviour checked. Review order of release when the product requires first-in, first-out handling. For uncapped product, include the permitted holding conditions and residence time in the process review.
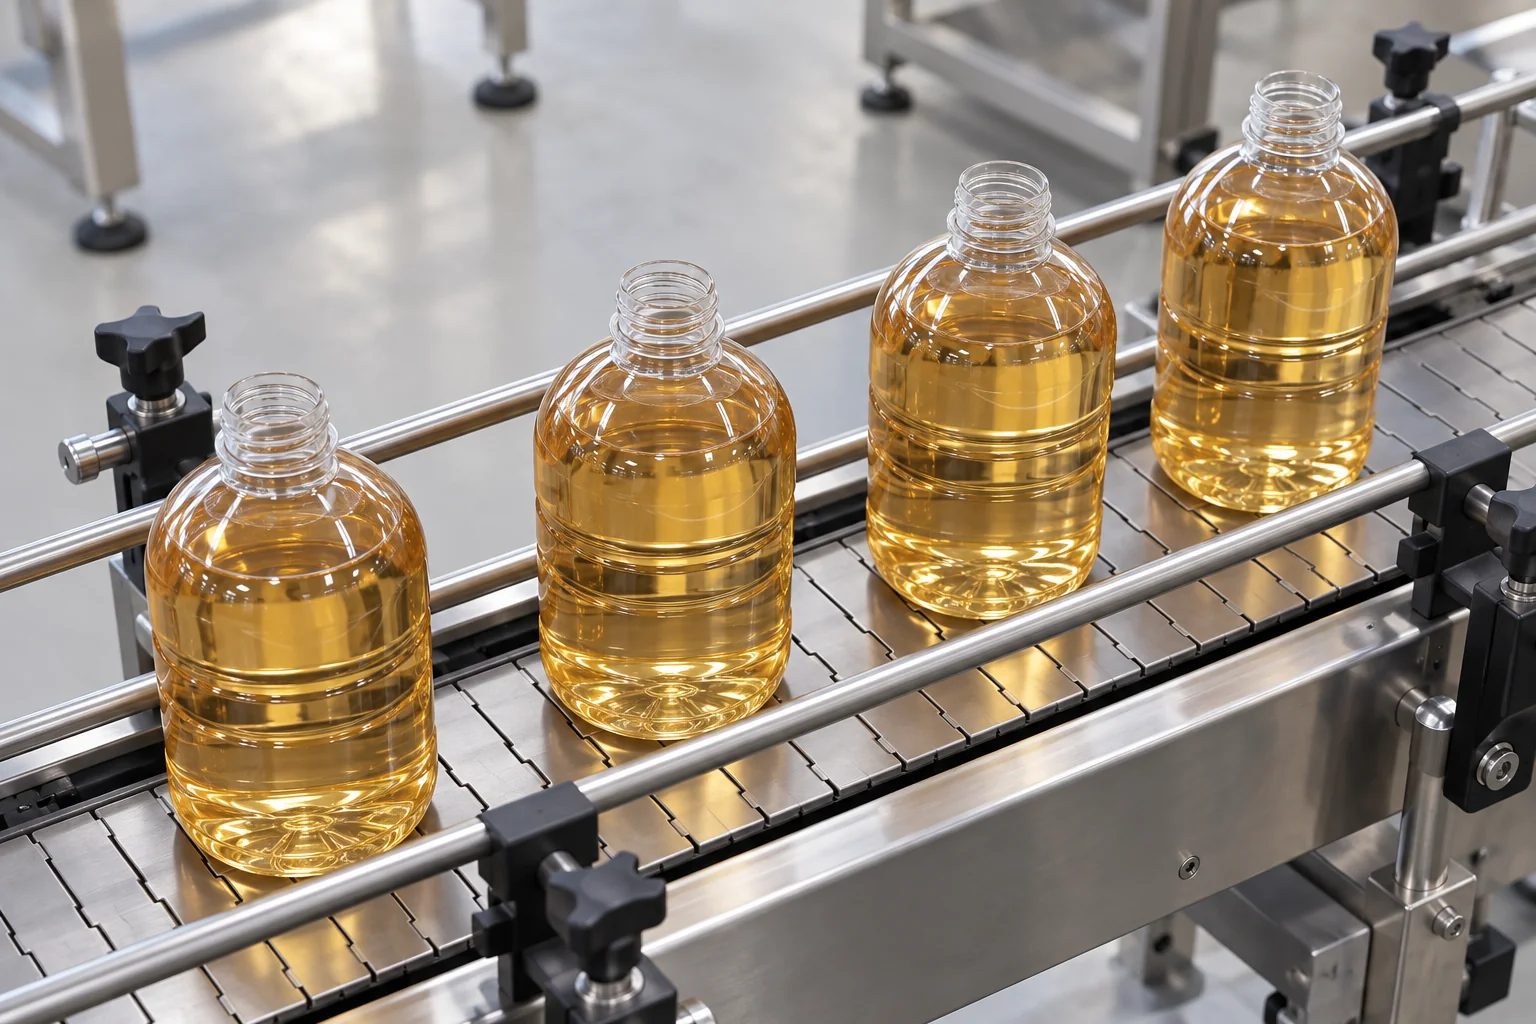
Check how fast the backlog clears after restart
Recovery requires a positive net withdrawal rate. Let Nextra be the bottles above the selected working occupancy at restart. With constant recovery rates, recovery time in seconds = 60 × Nextra / (qC,recovery − qF,recovery), valid only when qC,recovery is greater than qF,recovery. Equal rates preserve the backlog. A slower withdrawal rate makes it grow.
Use the capper’s approved acceptance rate for the actual bottle and closure, including its restart behaviour. The filler can also slow down or pause to create a positive drain rate. The objective is to return to working occupancy while maintaining fill and closure quality. Emptying every position may leave the capper short of the stock it needs for steady feeding.
Compare the calculated recovery time with the running interval available before the next relevant stop. When the rates ramp, integrate the actual net withdrawal over that interval. It must remove the extra inventory. Repeat the calculation across successive events when stop frequency varies or the next event starts with a partial backlog.
Check the whole handoff during recovery, including cap supply and bottle spacing at entry. A faster belt can change transport spacing, but the capper must still accept and close the arriving bottles. If it cannot, additional belt speed does not provide the missing withdrawal capacity.
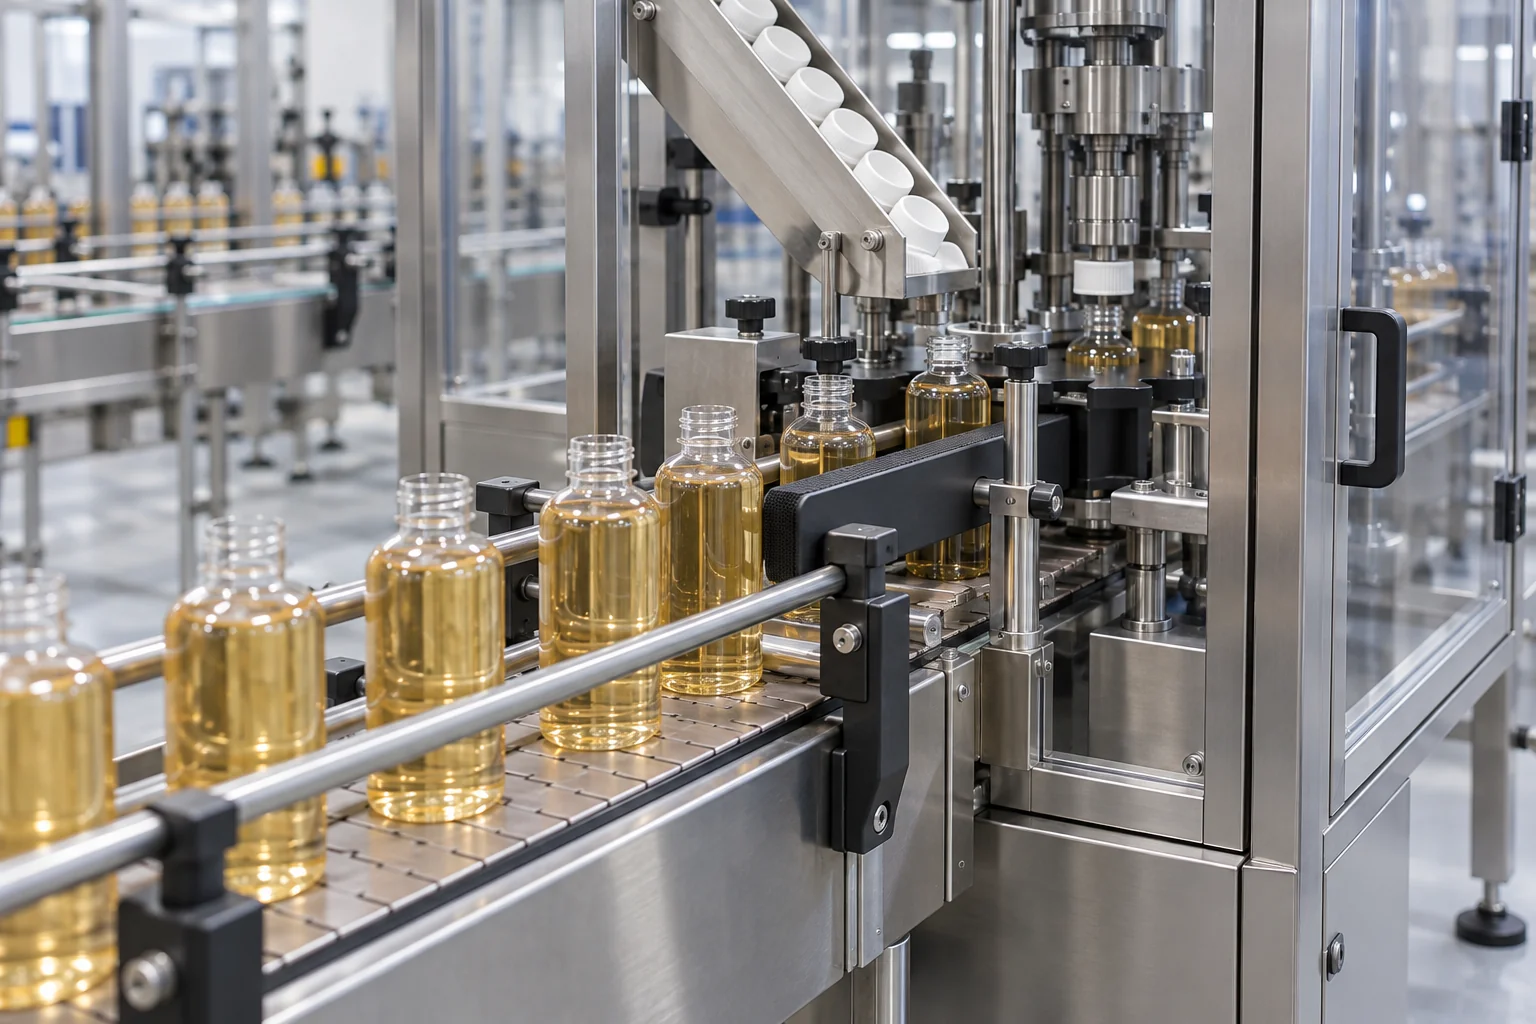
Set working occupancy for both upstream and downstream stops
Free space protects the filler when the capper stops; accessible bottles protect the capper when the filler stops. Select working occupancy against both events. Let Nlow be the minimum inventory needed to maintain feed through the actual transfer path. During a full filler stop, coverage in seconds = 60 × (N0 − Nlow) / qC, for qC greater than zero and N0 at least Nlow.
This feed-time calculation assumes the stock above Nlow can reach the capper at the required rate. Bottles stranded on a side path, behind a slow merge or in an unavailable zone cannot support that feed rate. Establish the minimum stock by observing the infeed under the agreed operating sequence.
For a chosen upstream-stop duration tu and downstream-stop requirement Nadd, the operating window is Nlow + ceil(qC × tu / 60) ≤ N0 ≤ C − M − Nadd. If the lower limit exceeds the upper limit, the current capacity and rate plan cannot cover both chosen events. Review storage, target rates or the required coverage rather than setting an arbitrary half-full target.
Choose the change that addresses the limiting condition
Use the capacity and recovery results together to decide whether to adjust controls, add usable storage or address a limiting station. Buying more accumulation solves a space deficit only when the handling and recovery conditions also work. Keep the selected bottle format and event history attached to the decision.
If a proposal calls the transfer an automatic post-filling conveyor unit, ask what it actually includes: transport, controlled accumulation, metering into the capper, or a combination of these functions. Specify the usable positions, permitted queue condition and coordinated stop/restart behaviour. The name alone does not define buffer performance.
| Observed condition | Engineering direction |
|---|---|
| Free space covers the stop and recovery completes | Validate the existing conveyor and control sequence for each format. |
| Free space is insufficient; recovery has capacity | Evaluate more usable length or an accumulator within handling and floor-space limits. |
| Backlog remains when another stop begins | Review restart rates, recurring faults and event frequency. |
| Sustained capper withdrawal is below filler inflow | Reduce upstream release or address the limiting downstream operation. |
| Bottles tip, spill or scuff before the space is full | Review accumulated pitch, guides, transfers, friction and queue pressure. |
| Transfer is mechanically coupled or process-controlled | Establish the permitted interface and stop strategy with the equipment and process owners. |
Verify the buffer through a complete stop-and-recovery sequence
Agree a controlled verification sequence with the responsible equipment and process team: steady production, a planned capper interruption, restart, return to working occupancy, then an upstream interruption. Repeat the relevant sequence to see whether backlog carries into the next event. Retain guards and interlocks, and use the approved controls for the test.
Record minimum and maximum inventory, physical inlet and outlet counts, stop and restart timestamps, block/starve signals and the time normal occupancy returns. Inspect the bottles and closures around each transition for the agreed acceptance characteristics. A rate trace that looks balanced still needs a handling and pack-quality check.
Repeat the review for formats that change diameter, travel orientation, filled mass or stability. Keep the event records with the marked layout and control sequence so capacity remains traceable after a format change. The equipment review and acceptance checks can then use the same boundaries as the original sizing calculation.
Common questions
How do I calculate buffer capacity between a filler and capper?
For a constant-rate interruption, round up the positive inlet–outlet difference in bottles/min multiplied by the stop duration in seconds and divided by 60. Add starting occupancy and the documented free-position reserve to get total required capacity. Then verify the usable geometry and recovery.
Can a buffer solve a capper that is always slower than the filler?
A finite buffer absorbs a temporary difference. Persistent excess inflow eventually uses all free positions. Match the sustained rates, change the limiting operation, or use a controlled upstream slowdown; also check that the backlog clears between interruptions.
Is conveyor length the same as accumulation capacity?
Usable capacity depends on accumulated bottle pitch, excluded zones, handling limits and access to the discharge. Existing bottles occupy part of that capacity. Measure the usable positions and subtract starting occupancy and reserve to find the free space for a stop.
What is packaging line output measured in?
Use containers or accepted packs per defined time, with the count location and running or elapsed period stated. For buffer sizing, count physical bottles crossing the inlet and outlet; for finished output, count packs passing the agreed acceptance checks.
What to send us
Swipe to compare all columns.
| Item | Why we need it | Example format |
|---|---|---|
| Station target and observed rates | Establish the inlet, outlet and recovery rate differences. | Bottle format, bottles/min at each station, count locations and timed run record. |
| Bottle geometry and filled condition | Calculate pitch and evaluate stability under accumulation. | Diameter or travel-direction envelope, drawing, filled mass and sample photographs. |
| Allowed backed-up length and layout | Separate usable storage from transfers and reserved zones. | Marked floor plan with conveyor lengths, guides, merges and capper infeed. |
| Occupancy and interruption history | Size peak added inventory and verify recovery before recurrence. | Starting bottle count, stop durations, response tail, restart trace and event frequency. |
We reply within 24 hours.